More than most psychology findings, the Dunning-Kruger effect gets a laugh every time.
Here goes:
Imagine that I give 100 people a grammar test. If my test is well-designed, it gives me insight into their actual knowledge of grammar.
I could divide them into 4 groups: those who know the least about grammar (the 25 who got the lowest scores), those who know the most (the 25 highest scores), and two groups of 25 in between.
I could also ask those same 100 people to predict how well they did on that test.
Here’s the question: what’s the relationship between actual grammar knowledge and confidence about grammar knowledge?
John Cleese — who is friends with David Dunning — sums up the findings this way:
In order to know how good you are at something requires exactly the same skills as it does to be good at that thing in the first place.
Which means — and this is terribly funny — that if you’re absolutely no good at something at all, then you lack exactly the skills that you need to know that you’re absolutely no good at it. [Link]
In other words:
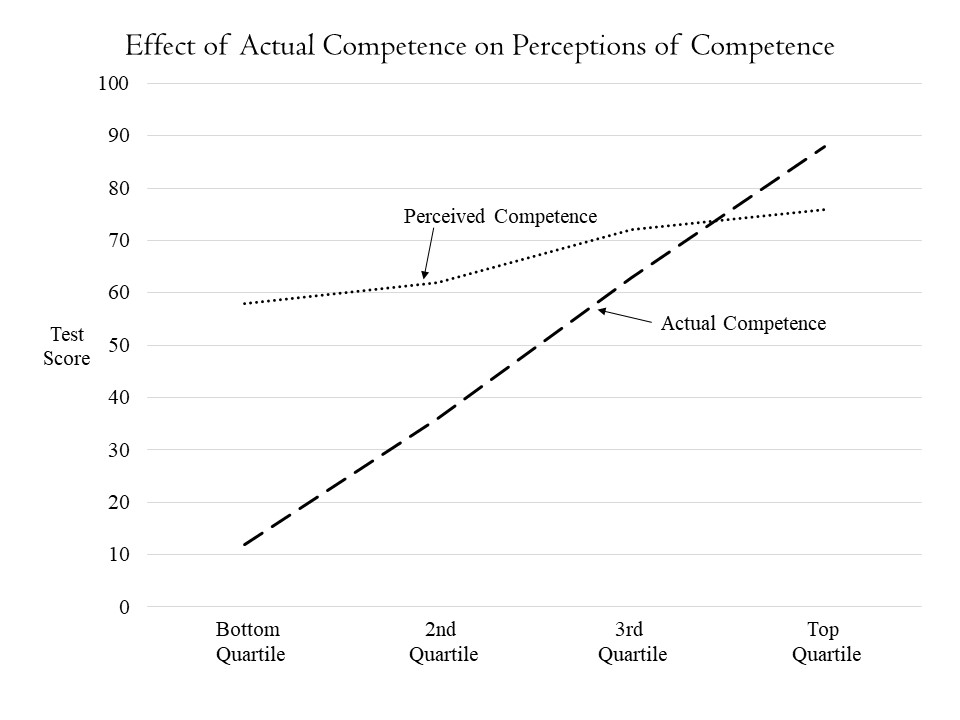
The students who got the lowest 25 scores averaged 17% on that quiz. And, they predicted (on average) that they got a 60%.
Because they don’t know much grammar, they don’t know enough to recognize how little they know.
In Dunning’s research, people who don’t know much about a discipline consistently overestimate their skill, competence, and knowledge base.
Here’s a graph, adapted from figure 3 of Dunning and Kruger’s 1999 study, showing that relationship:

Let the Ironies Begin
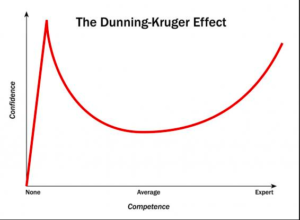
That graph might surprise you. In fact, you might be expecting a graph that looks like this:
Certainly that was the graph I was expecting to find when I looked at Kruger & Dunning’s 1999 study. After all, you can find that graph — or some variant — practically everywhere you look for information about Dunning-Kruger.
It seems that the best-known Dunning-Kruger graph wasn’t created by Dunning or Kruger.
If that’s true, that’s really weird. (I hope I’m wrong.)
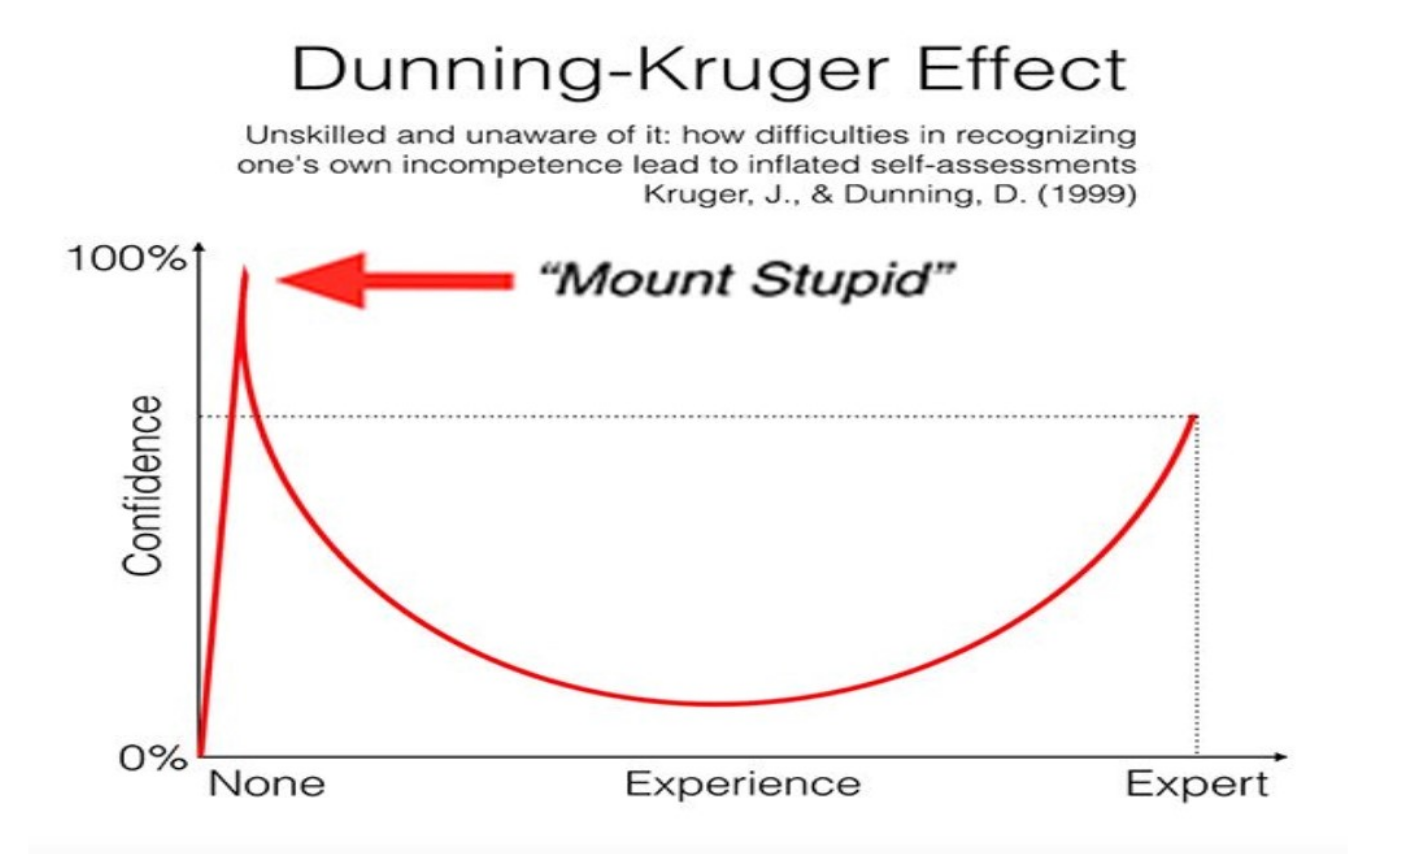
But this story gets curiouser. Check out this version:
This one has thrown in the label “Mount Stupid.” (You’ll find that on several Dunning-Kruger graphs.) And, amazingly, it explicitly credits the 1999 study for this image.
That’s right. This website is calling other people stupid while providing an inaccurate source for its graph of stupidity. It is — on the one hand — mocking people for overestimating their knowledge, while — on the other hand — demonstrating the conspicuous limits of its own knowledge.
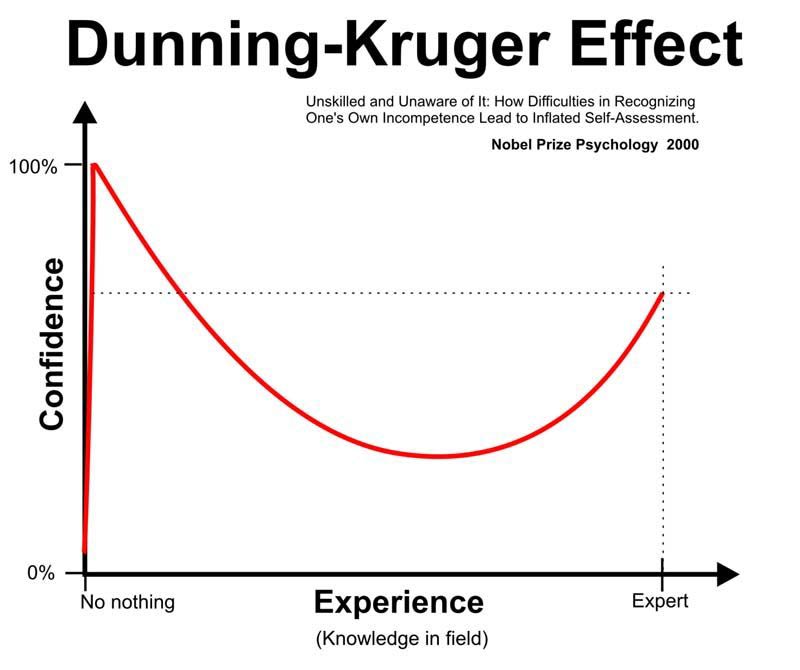
Let’s try one more:

If it’s not a joke, I have some suggestions. When you want to make fun of someone else for overestimating their knowledge,
First: remember that “no nothing” and “know nothing” don’t mean the same thing. Choose your spelling carefully. (“No nothing” is how an 8-year-old responds to this parental sentence: “Did you break the priceless vase and what are you holding behind your back?’)
Second: The Nobel Prize in Psychology didn’t write this study. Kruger and Dunning did.
Third: The Nobel Prize in Psychology doesn’t exist. There is no such thing.
Fourth: Dunning and Kruger won the Ig Nobel Prize in Psychology in 2000. The Ig Nobel Prize is, of course, a parody.
So, either this version is a coy collection of jokes, or someone who can’t spell the word “know” correctly is posting a graph about others’ incompetence.
At this point, I honestly don’t know which is true. I do know that the god of Irony is tired and wants a nap.
Closing Points
First: Karma dictates that in a post where I rib people for making obviously foolish mistakes, I will make an obviously foolish mistake. Please point it out to me. We’ll both get a laugh. You’ll get a free box of Triscuits.
Second: I haven’t provided sources for the graphs I’m decrying. My point is not to put down individuals, but to critique a culture-wide habit: passing along “knowledge” without making basic attempts to verify the source.
Third: I really want to know where this well-known graph comes from. If you know, please tell me! I’ve reached out to a few websites posting its early versions — I hope they’ll pass along the correct source.


