The plan for this blog post:
First: I’ll describe a particular teaching practice — one that I’ve used in my own work for quite a while.
Then: I’ll describe the reseach behind the practice — which I discovered just recently.
Finally: I’ll zoom back to offer a larger perspective.
The Potential Paradox of Dual Coding
Long-time readers know that I’m a fan of “dual coding.”
As Oliver Caviglioli has explained in his marvelous book, students learn more easily if our explanations include both visual and verbal representation.

That is: teachers should combine a description in words with a “stable visual representation” — a diagram or outline or graph. (Cavilgioli offers dozens — probably hundreds — of examples.)
This technique, although mightily helpful, requires lots of thought to pull off effectively. One problem in particular has raised challenges in my own consulting work.
On the one hand, I want to clarify the various cognitive science concepts I’m describing — say, tripartite attention, or schema theory, or even dual coding itself — by creating “stable visual representations” of them.
On the other hand, those concepts include LOTS of important pieces. A rich understanding of them requires grokking those pieces and the relationships among them.
For this reason, my “stable visual representation” — which exists to reduce working memory load — might in fact overwhelm working memory. SO MANY pieces. SO MANY important relationships.
What’s a consultant to do?
It Just Might Work…
Over the years, I’ve developed a technique that a) makes sense to me, and b) just seems to work.
I start by creating the final version of the “stable visual representation” I want teachers to understand.
For instance, I regularly show Dr. Efrat Furst’s “pyramid model” to explain schema theory:
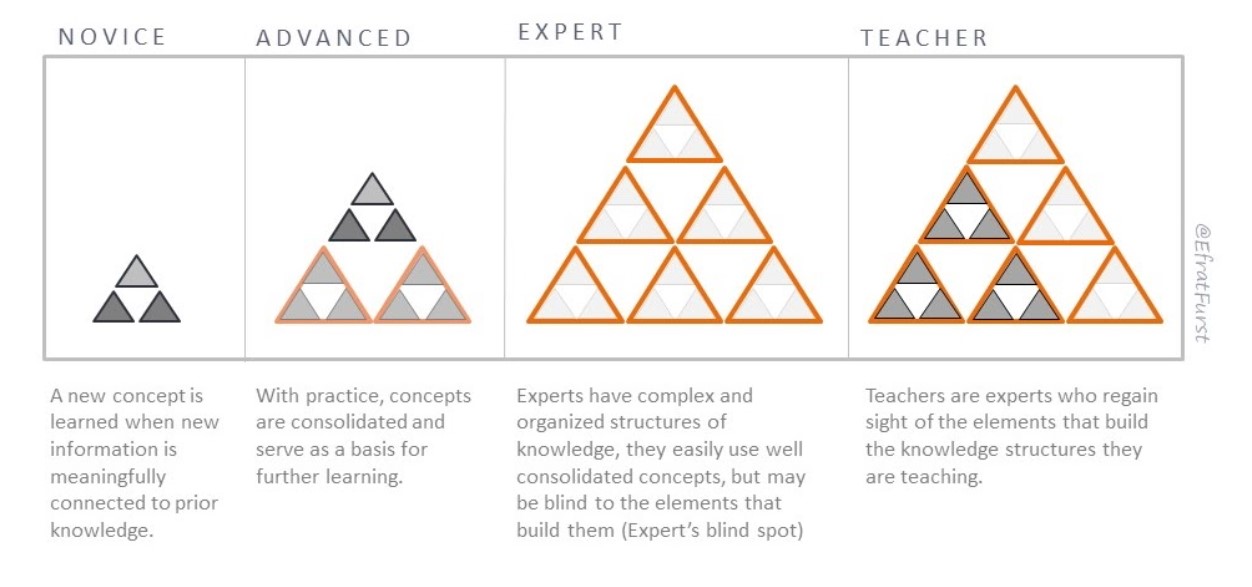
To explore this model in depth, you can check out Dr. Furst’s EXCELLENT website here.
As you can see, this model includes an ENORMOUS number of concepts (and relationships among them).
For that reason, I don’t start with the model itself; instead, I break it down into incremental pieces and add to them one at a time. (This is the teaching technique I promised at the top.)
So, my first slide simply has the four large grey rectangles: the barest visual outline of the diagram.
Only then — one at a time — do I add in “novice” and then “advanced” and then “expert.” (I don’t even mention “teacher” at this point — because the core distinction between “expert” and “teacher” won’t make any sense until the first three stages do.)
With the rectangles and the labels in place, then I’ll start talking about the three “novice” triangles on the left — in fact, only the two dark gray ones on the lower row. Teachers have to understand the concepts they represent before adding the third top triangle will be helpful.
And so forth.
In other words: presenting this diagram takes probably 10 PowerPoint slides and several dozen (more than 100?) animations.
In this way — I hope — I can successfully dual code the concept of schema theory.
I’m saying the words, and gradually … very gradually … unveiling piece by piece by piece the stable visual representation.
Of course, I’m not the only person to work this way. For instance: in Adam Boxer’s top-notch book Teaching Secondary Science, Boxer describes his method for explaning the anatomy and function of the heart with just such a step-by-step unveiling. If you haven’t read this book yet, you REALLY should.
But Wait, We’ve Got Research…
Usually in this field I find research that gives me new teaching ideas.
Occasionally I find reseach that supports teaching practices I’m already doing.
In this case: I’ve long hoped that reseach supports my step-by-step dual coding practice. But, to be honest, I never knew of any such research.
Recently, a friend mentioned something called the “dynamic drawing principle” — and sure enough, I struck research gold (or something close to it).
The first set of studies on this topic was done by research greats Logan Fiorella and Richard Mayer.
Over a series of four studies Fiorella and Mayer reached several tentative conclusions:
Students learn more when they see a professor draw diagrams representing the concepts under discussion — rather than seeing the professor talk about an already-drawn diagram.
This effect held when students saw the professor’s fully body while they drew, or simply the hand as it drew.
In some cases, the students’ prior knowledge mattered to these results; in others, it didn’t.
In another more recent study, Selen Turkay found that students learned more from animated drawing than from a video of a lecture, an audio recording of a lecture, and the finished drawings without the animation.
Although we don’t have lots-n-lots of research here, we have initial support for the teaching practice described above. That is: students seem to learn more when the dual coding diagram is created bit by bit in front of them, rather than revealed all at once.
That is, in a phrase, the “dynamic drawing principle.”
Not So Fast
If you’ve been reading closely, you’ve spotted a flaw in my claim that the dynamic drawing prinicple supports my piece-by-piece-PowerPoint method.
The flaw? Drawing.
My technique unveils and moves objects on the slides, but I don’t actually draw these diagrams live in front of the audience.
If you look at the complexity of Furst’s diagram, you can see it would be nearly impossible to do so. (And, I’m a terrible drawer. Friends even make fun of my handwriting…)
In fact, Fiorella and Mayer tested this very question. In their third experiment, some students watched a lecture with completed drawings, and others saw the drawings appear without a hand drawing them. (Fiorella and Mayer used an iPad drawing capture technology.)
Sure enough, students did NOT learn more from these handless live drawings than from completed drawings.
So, what will I do?
The Perfect Is the Enemy of the Good
As I see it, we have a small number of research studies which suggest…
… my piece-by-piece-PowerPoint idea is a good idea, but
… it might not help without live drawing.
That tentative research-based advice faces off against compelling experiences:
First: I simply could not possibly create these diagrams live. Not gonna happen. No ma’am.
Second: I regularly get compliments on my piece-by-piece method.
No, really. When I show my step-by-step visual explaining the functioning of working memory, for instance, teachers occasionally interrupt me to say “that was SO helpful.” (I am not making this up.)
And while I understand why live drawing might be better than PowerPoint revealing, I think my “dynamic-kind-of-drawing” technique is probably better than a Big Reveal of a complete, complex diagram.
For all these reasons, I’m going to keep going with my current practice.
And — I promise! — I’ll keep my eye out for further research that might persuade me to change my ways.
Fiorella, L., & Mayer, R. E. (2016). Effects of observing the instructor draw diagrams on learning from multimedia messages. Journal of Educational Psychology, 108(4), 528.
Turkay, S. (2022). Comparison of dynamic visuals to other presentation formats when learning social science topics in an online setting. Australasian Journal of Educational Technology, 38(5), 12-26.


Pingback: Weekly Round-Up: 4 October 2024 | Class Teaching